Motivation
The heart of my research project comes from my understanding and passion for Astronomy. In fact, in my undergraduate studies at the University of Maryland, I minored in Astronomy and interned at NASA Goddard for two years. Due to these experiences, I thought that this class project would be a great opportunity to apply the statistical methods learned in class to some real world astronomical data from NASA. Meteorites are much more than just space rocks, they can provide us with crucial information about everything from solar system formation to the origins of life on Earth (American Museum of Natural History, n.d.). Furthermore, according to the Planetary Science Institute, approximately 500 meteorites land on the Earth’s surface every year with only 10 recovered (Planetary Science Institute, 2019). This approximation tells us that there must be plenty of meteorites still to be discovered, which means there’s still lots of insights yet to be made from meteorites. These factors are what inspired me to pursue this project.
Project Summary
The goal of this project is to identify the frequency of meteorite landings throughout different time periods, most common geographic regions of meteorites, and the differences between meteorite landings in the northern and southern hemispheres respectively. The goal of this project would be an analytical pipeline to identify trends in meteorite landings and their respective geographical locations.
Project Contributions
In this project, I have contributed a comprehensive analysis that identifies what specific periods in the last century have experienced the most and least amount of meteorite landings. Additionally, this project makes use of the geographical coordinate data to compose detailed world maps of meteorite landing frequencies. Lastly, a hypothesis test was conducted to identify if northern hemisphere meteorite masses are significantly different from southern hemisphere meteorite masses.
I have addressed 4 main research questions in my analysis. The first question asks what years have the highest and lowest frequency of meteorite landings in different time periods within the last century. Next, I ask what areas of the world do meteorite landings occur most often and if this distribution changes over time. My third question asks what the distribution of meteorite landings looks like. Lastly my fourth question is if northern and southern hemisphere meteorite masses are significantly different.
Methodology
Data Collection
The dataset for my analysis is the Meteorite Landings dataset developed by NASA. The data was downloaded directly from NASA’s Kaggle repository (NASA & Kaggle, 2016). The dataset is also directly available from NASA’s Data Portal. The data was in normal Comma Separated Value format (CSV), which made it relatively easy to import into Python. There were also over 45,000 rows of data, which provided the analysis with plenty of samples to work with. The programming for this analysis was done via Google Colab for easy access.
Data Curation, Cleaning, & Annotation
According to the Kaggle repository, some of the date information was incorrectly parsed when the dataset was created, so only data from years 1800-2016 were used. Additionally, some of the geolocation data had 0 degrees longitude and latitude, and were said to be treated as NA. Any rows with NA values in any variables were filtered out using the .dropna() function in Pandas to ensure data validity. In order to address one of my research questions, a new column had to be made to easily distinguish which hemisphere (Northern or Southern) the meteorite was found in or fell. Any other columns that were not used were dropped.
Summary of variables:
| Variable | Description | Data Type |
|---|---|---|
| Mass | The mass of the meteorite in grams. | INT |
| Year | The year the meteorite fell or was found. | INT |
| reclat | Latitude coordinate. | FLOAT |
| reclong | Longitude coordinate. | FLOAT |
| GeoLocation | Set of longitude and latitude coordinates. | SET |
| Hemisphere | Hemisphere in which a meteorite was found or fell. | STR |
Solution Framework
Since I completed my analysis using Google Colab, I was able to easily organize my code into sections. In my Google Colab notebook, I separated my code into the following sections:
-Imports (Code dependencies)
-About the Data (Brief overview of the data)
-What years had the highest and lowest frequency of meteorite landings in past and present?
-In what areas of the world were meteorite landings most common? Does the distribution change over the years?
What is the distribution of masses amongst all of the meteorites?
-What differences are there in the masses of Northern vs. Southern Hemisphere meteorites?
Key Points (Results)
By separating the notebook into these different sections, I was able to clearly address all of my research questions in an organized manner. Additionally, for the geographic coordinate plots, I defined a function that used a dataframe as an argument so that I can easily reuse the code and plot graphs for different time periods. Furthermore, I have commented much of my code to ensure that anyone reading it can easily follow along with my thought process. This is how I organized my data pipeline.
Experiment Result
Experiment Setup
For my first experiment, which looks at frequency of meteorite landings over different time periods, I defined two main time periods of past and present. I defined the “past” time period as any year between 1990 and 1950. For the “present” time period, I defined it as any year after 1990. These two time periods I think give a good representation of “historical” versus “current” data. For my next question which looks at geographic coordinate data of meteorite landings, my setup was to overlay a scatterplot of the coordinates onto a world map using the Geopandas library. This allowed me to create images for each time period, and then visually compare where the differences in meteorite landings occurred. In my hypothesis test, I wrote out the null hypothesis and alternative hypothesis in comments in the code, so it is easy to see what I am testing. I then created comments for each step of the calculations including the point estimate, degrees of freedom, standard error, t-score, and p-value. Furthermore, I added print statements throughout my code to show what the values at each step were respectively.I hope that by organizing my experiment this way it is easy for others to follow.
Results & Findings
In my analysis, I was able address all of the questions initially stated. The results from this analysis are also listed in the “Key Points” section of my Google Colab notebook for easy access. The first question asked what years had the highest and lowest frequencies of meteorite landings in the past and present. In this analysis, I created line plots for each time period to show the change in frequency over time.
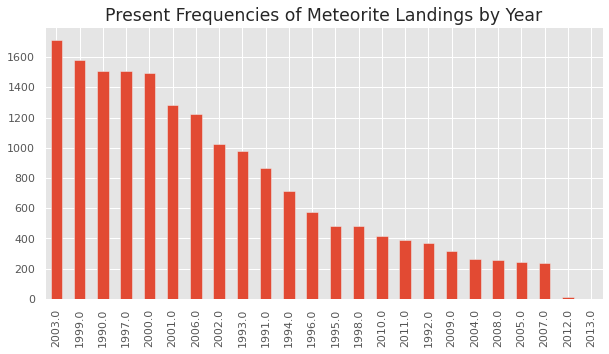
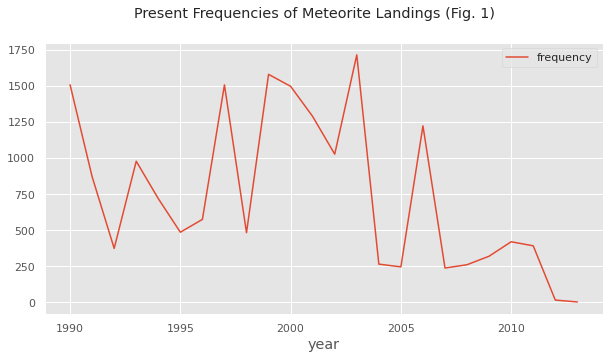
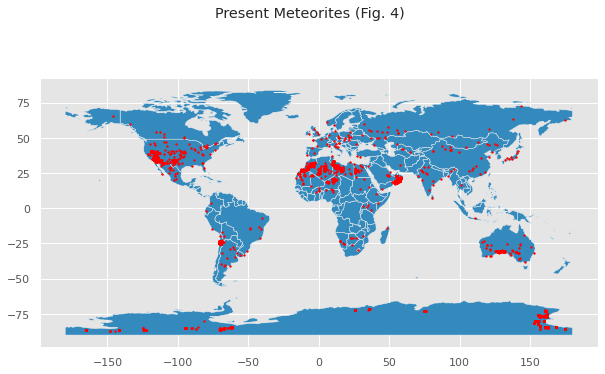
As we can see from the figures above, it was found that 1937 and 2003 were the years with the highest frequency of meteorite landings in the past and present respectively,while 1901 and 2013 had the least number of meteorite landings in the past and present respectively.The next result I found in my analysis was that there was a general trend of meteorites landing in the western US, Southern South America, Africa, Southern Australia, and parts of Europe. Another major trend that I noticed is that most meteorites seem to land along the 25°N and -25°S latitude lines. These main trends can be seen by directly comparing the plots of present and past meteorites, as shown below.

Present Meteorites (Fig.4)
The next research finding that I made applies to the masses of the meteorites. It was found that a majority of the meteorite masses fall below 250 grams (Fig. 5).
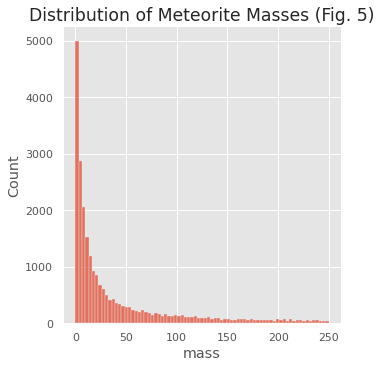
From this distribution plot, we can tell that the distribution of masses of meteorites is highly skewed to the right and is unimodal. If we plot the meteorites that are abnormally large compared to the meteorites that fall below 250 grams, we get the following plots (Fig. 6 & 7).
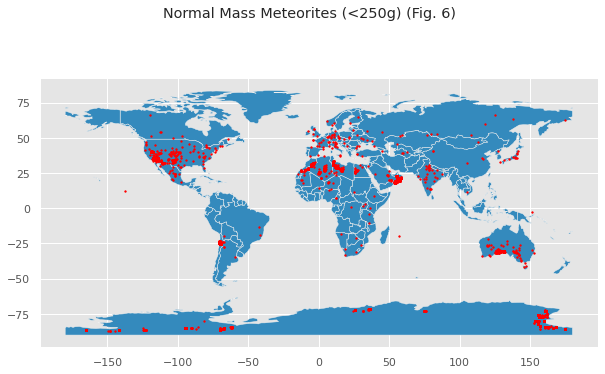
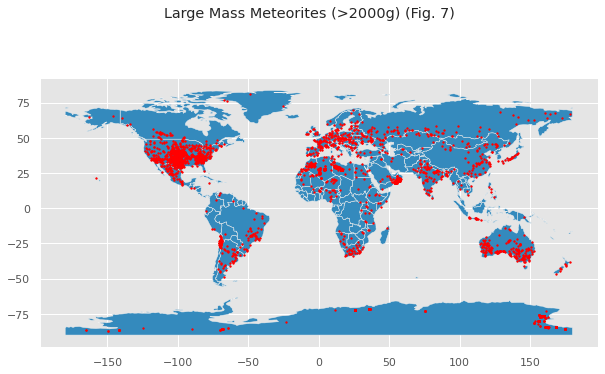
From these plots we can see that there seem to be more large mass meteorites in Southern Africa, the US, and parts of South America. Lastly, I found in my analysis the differences between meteorites in the Northern and Southern Hemispheres respectively. For example, by plotting the average masses of northern and southern hemisphere meteories, we can see that Northern hemisphere meteorites have a much higher average mass than Southern hemisphere meteorites (Fig. 8).
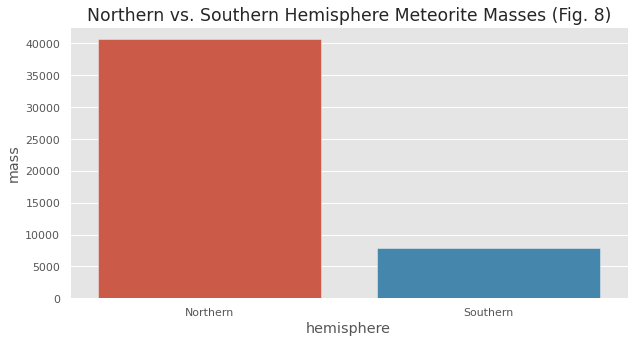
This finding led me to inquire whether there is a statistically significant difference in the masses of northern and southern hemisphere meteorites. From this research question I developed my null hypothesis and alternative hypothesis:
H0: There is no difference between the masses of meteorites in the hemispheres. (avg difference 0)
HA: There is a difference between the masses of meteorites in the hemispheres. (avg difference!=0)
I then conducted a hypothesis test and calculated the p-value with an alpha set at 0.05 to test for statistical significance. Since my p-value was around 0.0011, we can reject the null hypothesis and conclude that there is a significant difference in the masses of meteorites in the Northern and Southern Hemisphere. More research is needed to determine if there is any reason for this relationship.
Limitations
Although there were many interesting results from this experiment, there were also some limitations that need to be taken into account. The first limitation was that the highly skewed distribution of masses might impact the validity of the hypothesis test that was conducted since it is not normally distributed. However, in future analysis this could possibly be fixed by applying a transformation of the data, such as a log transformation. Additionally, while the most frequent meteorite landing regions were identified, future analysis could go into finer detail as to what specific areas of these regions experience more landings. This would give us greater insight into if there are any specific places in the world that experience more meteorite landings than others. Lastly, my limited knowledge on meteorite class types made it hard to use that variable that was originally present in the data. This variable could prove to be useful in a future analysis.
Conclusion
Overall, I believe that the results that the experiments yielded were very interesting and I thoroughly enjoyed researching this topic. This research has reaffirmed to me that there is still much more we can learn about meteorites and what information they gleam about other astronomical processes. Although there are some limitations to this study, I am confident that further research would greatly improve these experiments.